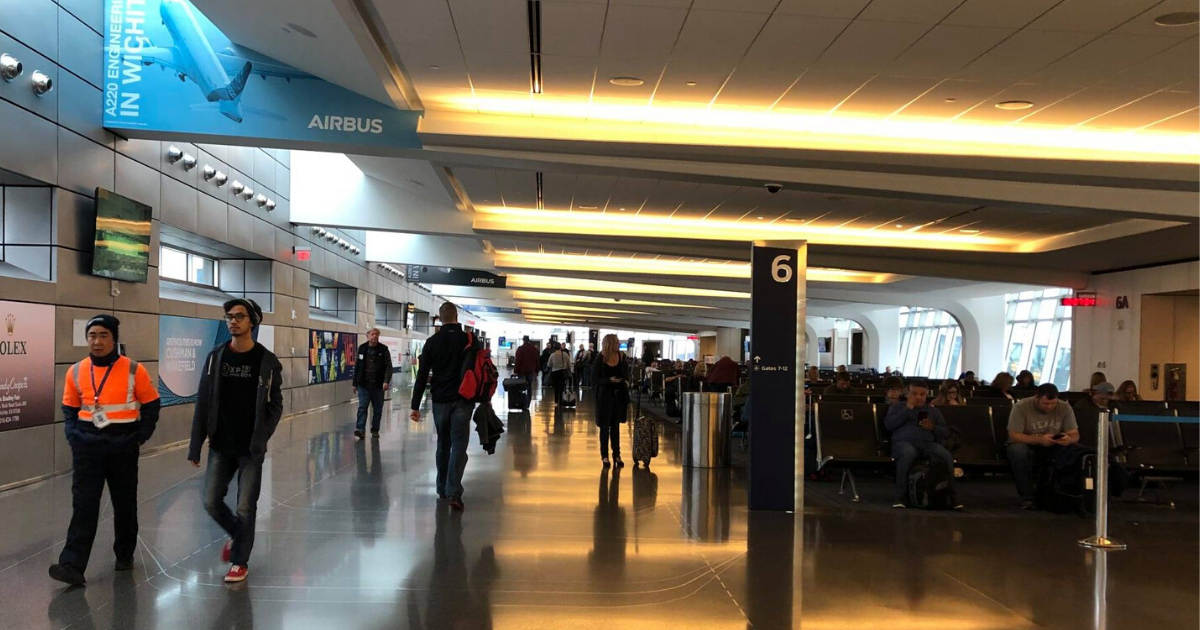
October total passengers were up .91%, enough to make 16 consecutive months of increased traffic at ICT. October’s total passengers were 152,555 which is a new high for the month of October. October enplanements increased 1.93% while seats were up only .6%; flights are full.
Total air cargo was down 2.43% for the month but is up 5.79% year-to-date. For October, food and gift receipts were up 10.45%, rental cars up 8.31%, and parking revenue up 4.64%.
Highlights for the month:
- American had the largest increase during October with enplanements increasing 14% over Oct. 2018.
- American also had the biggest increase in capacity in October, with a 15.2% increase in seats and 9.1% increase in flights compared to October 2018.
- Overall, October available flights were down 1.4% but available seats were up .6%.
- Average load factor in October was 86%
- For the month, enplanements were up 1.93%; deplanements were down .10%, and total passengers were up .91%.
- October total passengers – 152,555 – set an all-time high for the month. The previous record occurred in 2018 with 151,180 total passengers.
- Year to date: enplanements are up 5.92%, deplanements are up 5.44%; total passengers are up 5.68%
Airport statistical reports can be found in Airport Business.
October 2019 Passenger Traffic
| AIRLINE | OCT. 2019 | OCT. 2018 | # Difference | % Difference |
|---|---|---|---|---|
| Alaska | 4,281 | 4,122 | 159 | 4% |
| Allegiant | 5,264 | 5,111 | 153 | 3% |
| American | 41,271 | 35,450 | 5,821 | 14% |
| Delta | 32,225 | 30,990 | 1,235 | 4% |
| Frontier | 4,072 | 3,942 | 130 | 3% |
| Southwest | 26,422 | 27,389 | -967 | -4% |
| United | 39,020 | 44,095 | -5,074 | -13% |
| Charters | - | 81 | -81 | -100% |
| TOTAL | 152,555 | 151,180 | 1,375 | 1% |

