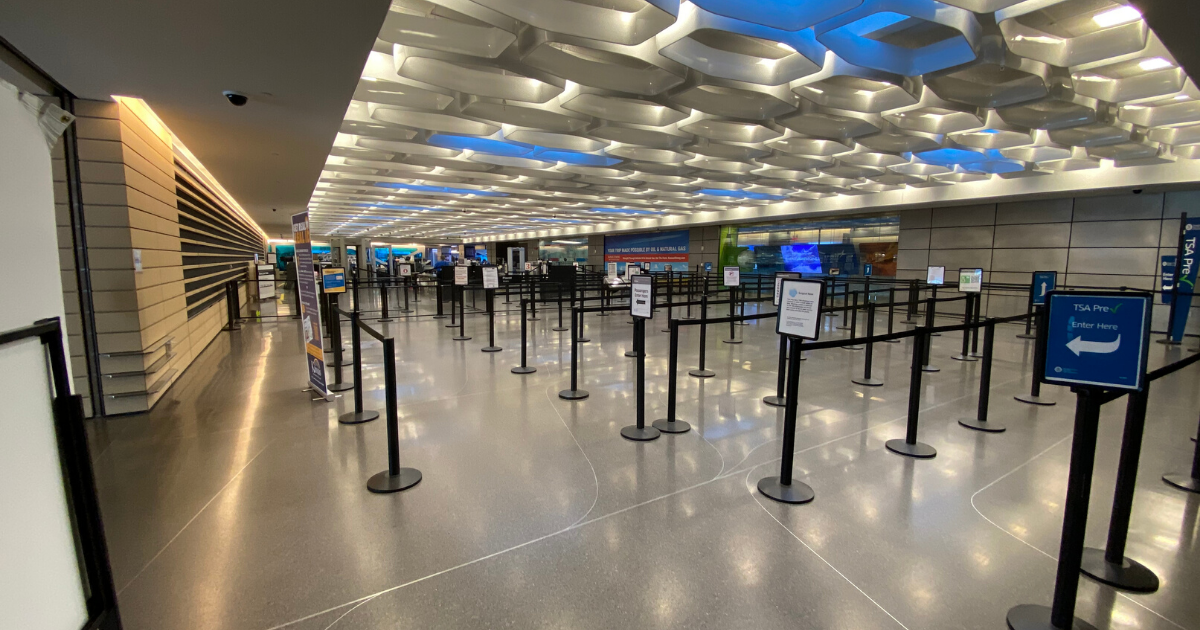
Passenger traffic at Wichita Eisenhower Airport plummeted 47% in March due to COVID-19. For the month, a total of 76,470 passengers flew in and out of ICT compared to 143,695 last March, setting a new record low for the month of March. The last time there were so few passengers was in February 2002 when only 74,683 passengers flew in and out of the airport. At that time, airports across the nation were still recovering from the 9/11 attack.
So far in April, enplaned passengers are averaging about 90 per day compared to 2,272 daily passengers last April, a reduction of 96%.
March 2020 Total Passengers
| AIRLINE | MARCH 2020 | MARCH 2019 | # DIFF. | % DIFF. |
|---|---|---|---|---|
| Alaska | 2,037 | 4,182 | (2,145) | -51% |
| Allegiant | 5,534 | 6,202 | (668) | -11% |
| American | 23,134 | 39,482 | (16,348) | -41% |
| Delta | 13,190 | 29,419 | (16,229) | -55% |
| Frontier | 2,265 | 3,108 | (843) | -27% |
| Southwest | 11,944 | 26,163 | (14,219) | -54% |
| United | 18,246 | 34,897 | (16,651) | -48% |
| Charters | 120 | 242 | (122) | -50% |
Airlines have drastically reduced flights and airfares but continue to operate, mostly to haul medical personnel and cargo. The capacity scheduled for Q2 2020 is down 26% from Q2 2019. The chart below shows week-over-week capacity changes based on airline schedules. St. Louis shows an increase due to Southwest adding a third daily flight; however, Southwest is suspending service to Las Vegas and Phoenix. Airlines are constantly monitoring future bookings and for now, are planning to have more capacity in June. It is hoped that passengers will start taking their much-needed vacations then.
Week-Over-Week Capacity Changes
| Schedule Load Date | Schedule Load Date | Week Over Week | Week Over Week | |
| Market | This week 4/13/2020 | Last week 4/6/2020 | Change # | Change % |
| Overall | 209,942 | 233,638 | -23,696 | -10% |
| Phoenix | 5,480 | 14,448 | -8,968 | -62% |
| Las Vegas | 9,669 | 18,637 | -8,968 | -48% |
| Atlanta | 23,722 | 30,966 | -7,244 | -23% |
| Minneapolis | 9,214 | 12,146 | -2,932 | -24% |
| Houston | 18,667 | 20,065 | -1,398 | -7% |
| Denver | 28,012 | 29,318 | -1,306 | -4% |
| Chicago | 25,852 | 26,324 | -472 | -2% |
| Seattle | 6,764 | 6,916 | -152 | -2% |
| St. Louis | 31,464 | 23,720 | 7,744 | 33% |

